Top
- Share link: charts
- See categories: Charts and graphs and maps.
The drug war causes the high U.S. incarceration rate.
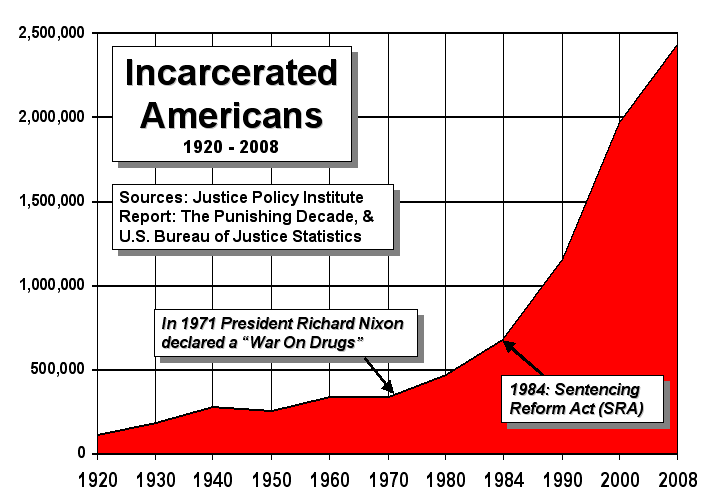
| The majority of people incarcerated in prisons and jails in the USA are in due to drug-related offenses, crimes to get money for drugs, or drug-related parole or probation violations. Wikipedia: Drug-related crime. The number of inmates in the USA has increased almost 5 times over since 1980. It peaked in 2008. Obama's Democrat landslide in 2008 turned the incarceration rate around. The cost of the U.S. drug war is at least 1.5 trillion dollars. Cannabis is safer! Share link. |
USA. Adult and juvenile correctional population
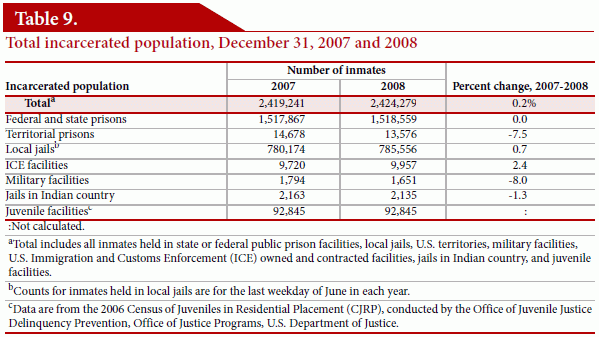
| USA and territories. 2,424,279 inmates in 2008. ... |
| In 2008 with less than 5% of world population the USA had 2.4 million of 9.8 million world prisoners (b). See latest numbers and World Prison Population List. The majority of inmates in the USA are in due to the drug war. The number of inmates in the USA has increased almost 5 times over since 1980. It peaked in 2008. |
 From U.S. Bureau of Justice Statistics. See template. See source info. |
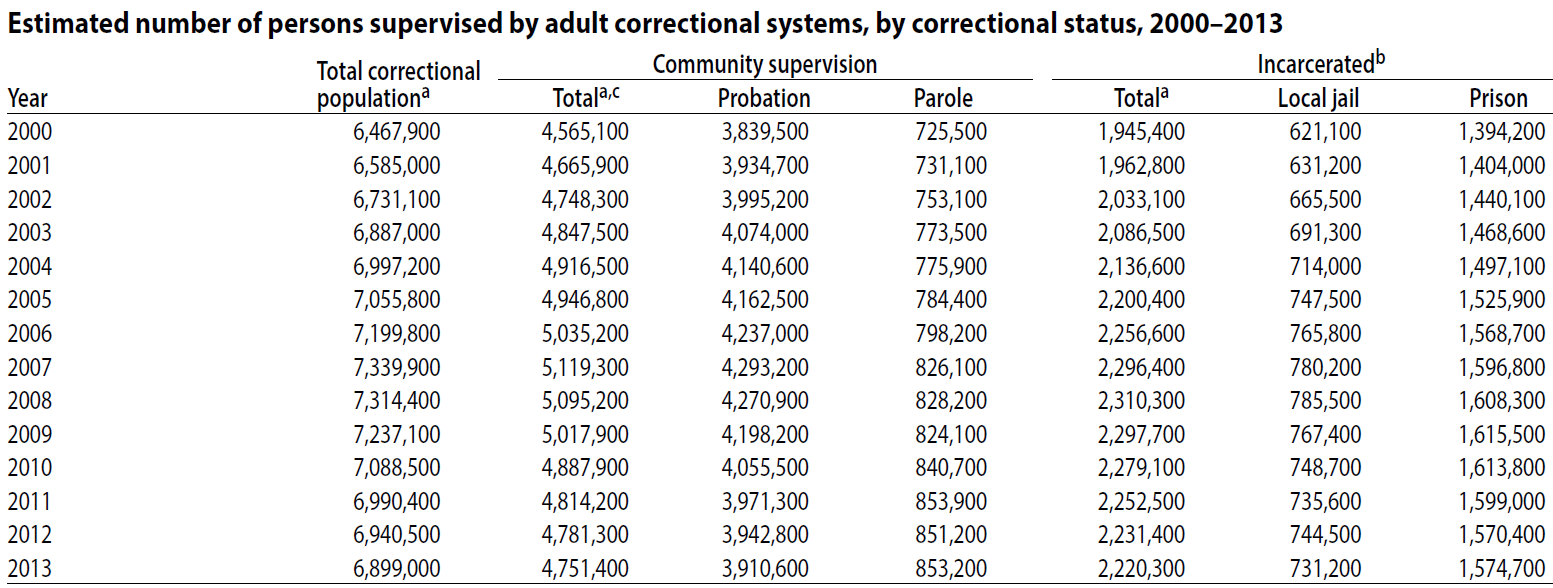
USA. Adult and juvenile inmate stats. Share link.
-

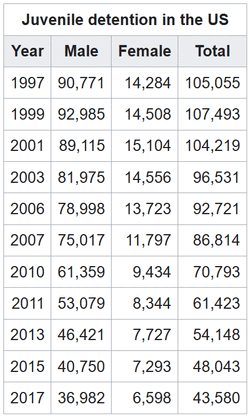
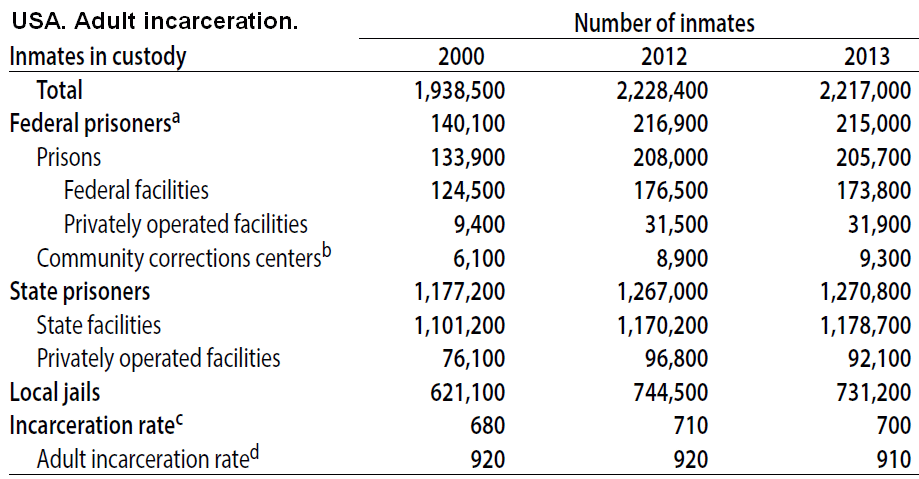
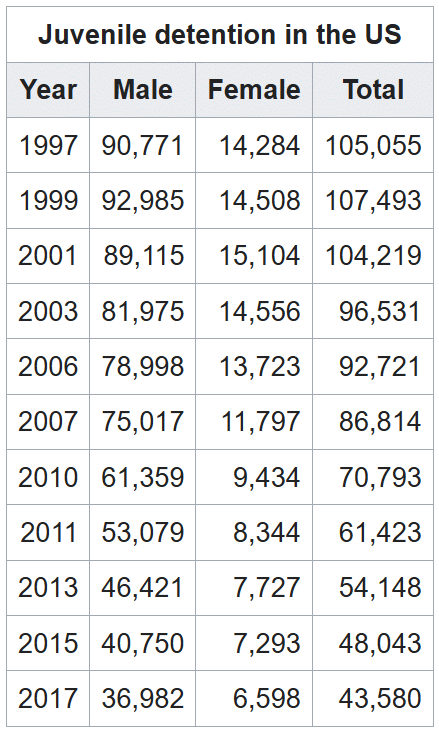
Source: Correctional Populations in the United States, 2013. See Appendix Table 2 in PDF. From U.S. Bureau of Justice Statistics. Incarceration rate is per 100,000. See template. See juvenile detention numbers.
-
Correctional Populations in the United States. By Bureau of Justice Statistics. See info.
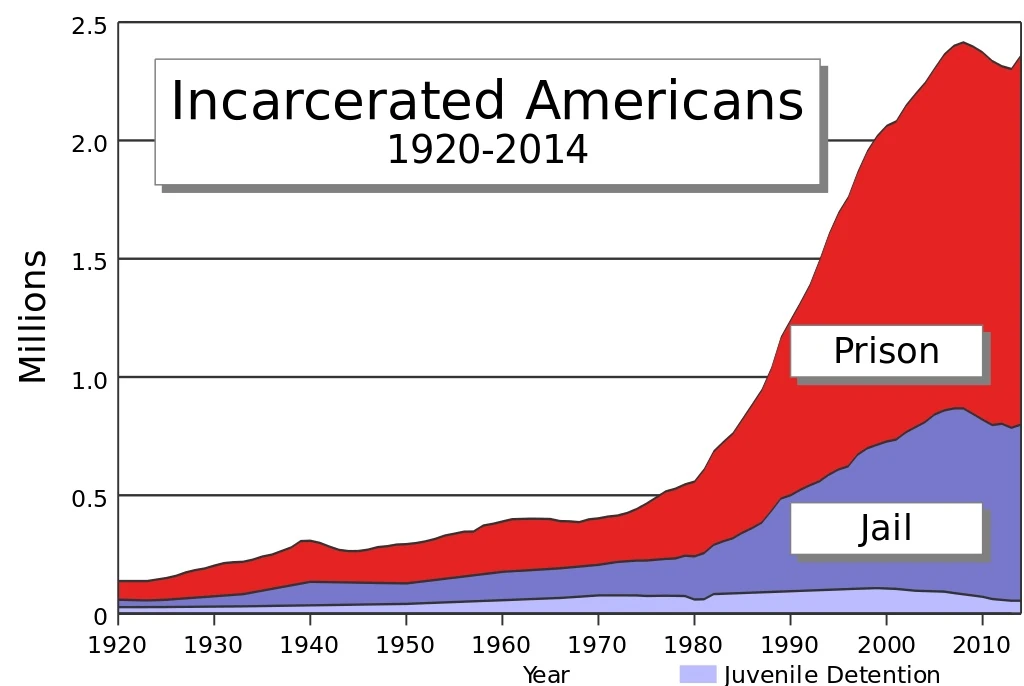
Long timeline of U.S. incarceration
|
|
|
November Coalition graph. Some Congressmen and police who prosecuted the War on Drugs now believe it caused a large increase in the United States incarceration rate. See Law Enforcement Against Prohibition, and larger chart with sources. See template. Incarceration peaked in 2008. |
|
Cost of U.S. drug war
| Cost of U.S. drug war. Even $1.5 trillion dollars is conservative since many crimes are committed in order to get money for drugs. State prisons averaged $31,268 per inmate in 2010. See: Drug war causes high U.S. incarceration rate. See: Economics - Drug War Facts. See: 32 Reasons Why We Need To End The War On Drugs - Business Insider. See: The Budgetary Impact of Ending Drug Prohibition. |
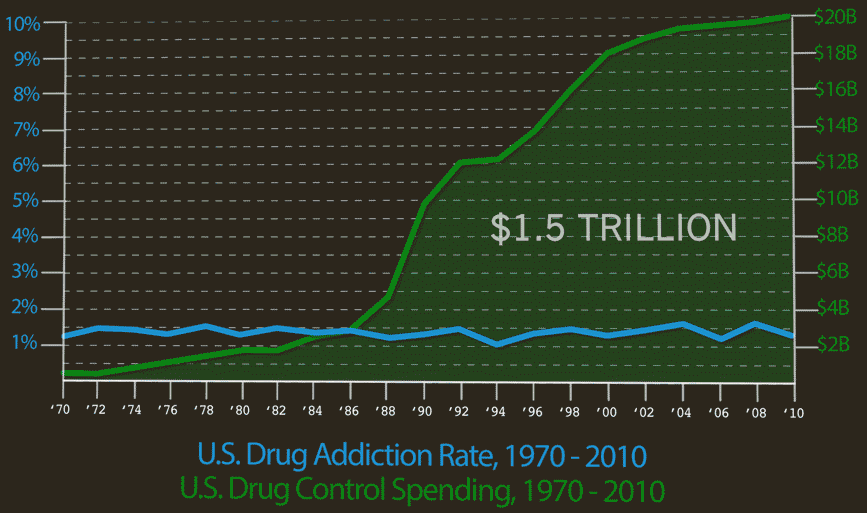

A Chart That Says the War on Drugs Isn't Working. By Serena Dai. The Atlantic Wire. 12 Oct 2012. "The numbers on this chart alone don't add up to $1.5 trillion, which represents a more inclusive count of drug control spending, with prison costs and state level costs determined by the Office of National Drug Control Policy, but instead to $800 billion." See: Cost of U.S. drug war. Share link.

Cost of criminal justice system in the USA
| ||||||||||||||||||||||||||||||
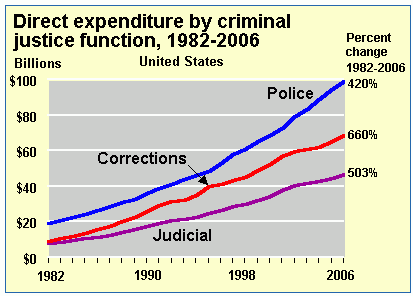 $228 billion total in 2007 according to BJS data. $36 billion in 1982 (not adjusted for inflation). Detailed yearly costs timeline is here (scroll down). See inflation-adjusted chart. BJS is U.S. Bureau of Justice Statistics. The majority of prisoners are incarcerated due to the drug war. See drug war charts and maps. State prisons averaged $31,286 per inmate in 2010. See: Costs of U.S. drug war. |
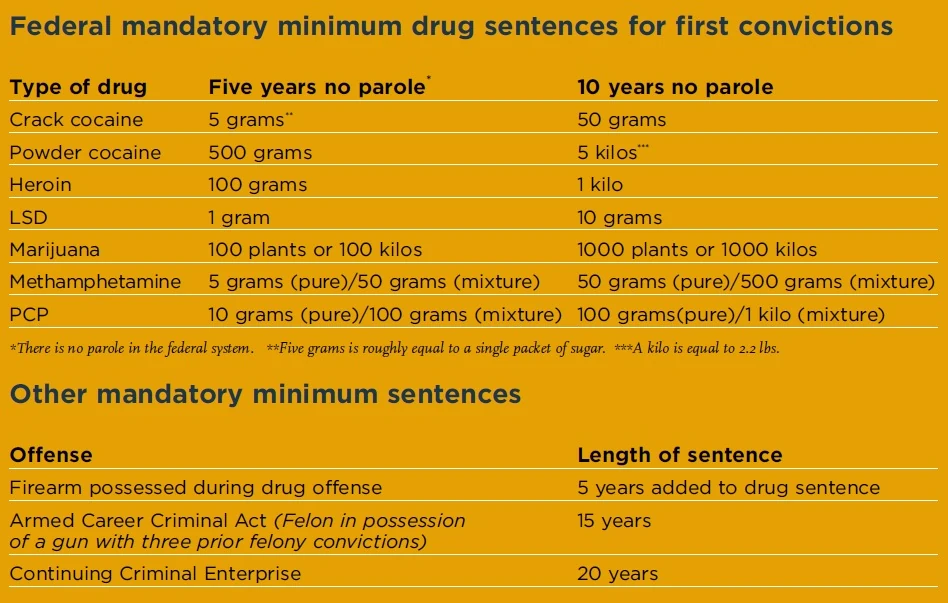
U.S. federal mandatory minimum sentences
First mandatory minimums chart below is from an older FAMM report, "Correcting Course: Lessons from the 1970s Repeal of Mandatory Minimum Sentences". FAMM is Families Against Mandatory Minimums. [3]. See Wikipedia: Mandatory minimums. The Fair Sentencing Act of 2010 increased the amounts of crack cocaine required to trigger 5 and 10 year sentences. [4]. See revised charts since then. Share link to this page.
For charts of all federal mandatory minimums (not just for drug offenses), go here.
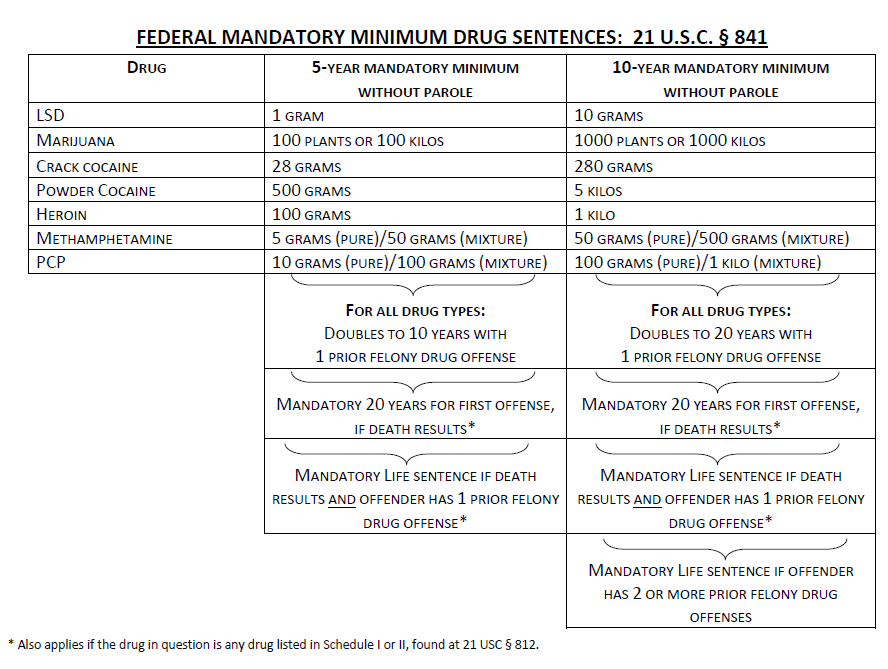
Later chart with revisions, such as the amount of crack cocaine required for various sentences:
Marijuana Majority
It is now up to 58% for legalization in some polls.
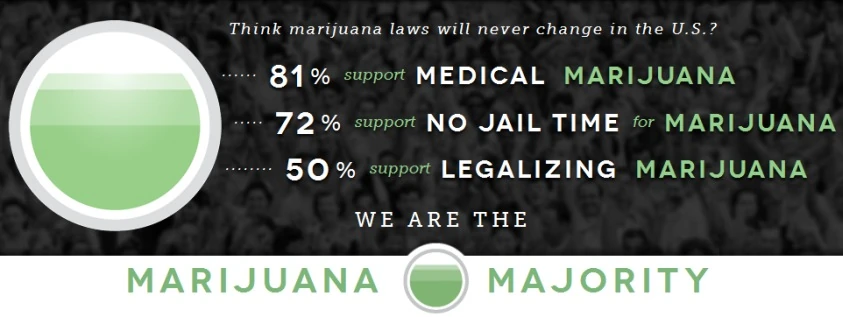

Chart of some incarceration rates worldwide
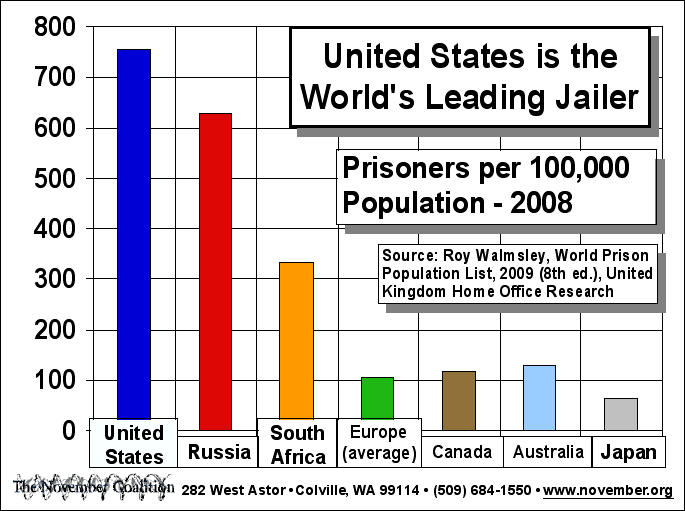  See sourcing here. See charts and maps. Go here for latest incarceration rates for many nations. See Wikipedia list. See this category. Share link. See: Number incarcerated in the USA peaked in 2008. |
Map of incarceration rates worldwide
  Prisoners per 100,000 population. Gray in the map means no data. See the Commons image page for sources and more info. See List of countries by incarceration rate. See template. Article: Compare incarceration rates. |
| The map may be old. The latest data is here: Highest to Lowest - Prison Population Rate. From World Prison Brief. Incarceration rates are based on inmates in both prisons and jails. |
USA timeline. Prison, jail, probation, parole
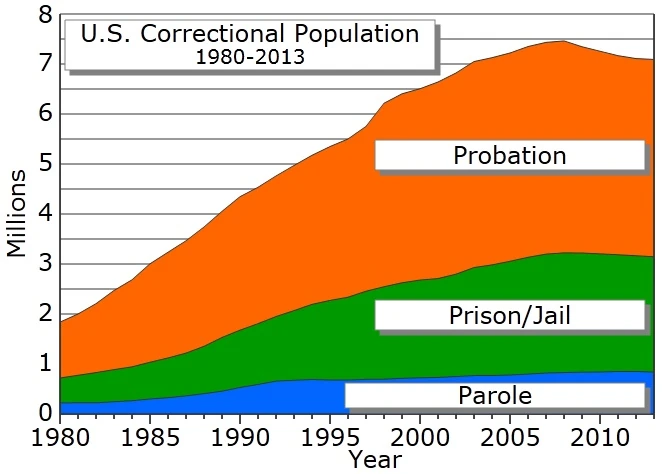  USA: Peak of 7.3 million people in 2007 under adult correctional supervision: On probation or parole, or incarcerated in jail or prison. About 3.2% of the U.S. adult population, or 1 in every 31 adults. More info here. See template. |
USA. Incarceration rates by race and ethnicity
 Incarceration rates for adult males in U.S. jails and prisons by race and ethnicity. At midyear 2009, an estimated 4.7% of black non-Hispanic men were in prison or jail, compared to 1.8% of Hispanic men of any race, and 0.7% of white non-Hispanic men. Sources. More info: Race, ethnicity, and the drug war. See template. |
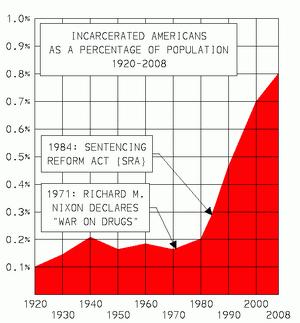
USA timeline. Incarceration as a percentage of Americans
 Timeline of U.S. incarceration in prisons and jails as a percentage of Americans of all ages. See template. Image source and data. |
USA. Cannabis arrests over time
Cannabis arrests. See:
http://www.norml.org/share/marijuana_arrests_chart500_short.gif
See source of above graph.
http://norml.org/share/marijuana_arrests_chart.gif
See source of above graph.
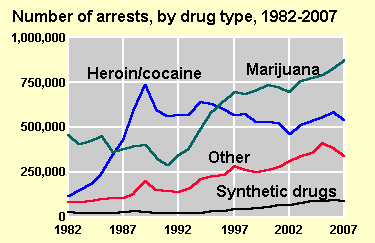
USA. Number of drug arrests over time, by drug type
| U.S. drug arrests |
|---|
|
|
|
Chart above from United States Bureau of Justice Statistics (BJS). See image info and sources. See cannabis arrests. |
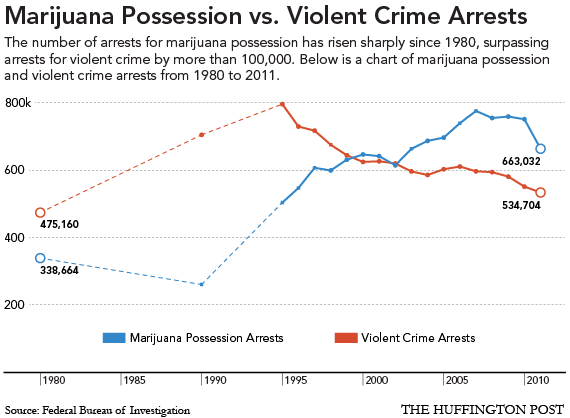
USA. Marijuana possession versus violent crime arrests
Marijuana Possession Arrests Exceed Violent Crime Arrests (INFOGRAPHIC). 17 Jan 2013. Huffington Post.
Drug war and incarceration rates worldwide
- Share link: compare. This article was written by Timeshifter. See many drug war charts and maps. And: Drug war causes high U.S. incarceration rate. And: The U.S. Drug War. Republicans lead. And: Drug War, mandatory minimum sentencing, handguns. And: The number of people incarcerated in the USA peaked in 2008.
Charts and maps
| See list of incarceration rates by country (b c). Compare the rates. Due to the Drug War and long mandatory sentences the USA had the highest incarceration rate in the world for awhile. See cost of U.S. drug war: 1.5 trillion dollars! |
| The majority of people incarcerated in prisons and jails in the USA are in due to drug-related offenses, crimes to get money for drugs, or drug-related parole or probation violations. Wikipedia: Drug-related crime. The number of inmates in the USA has increased almost 5 times over since 1980. It peaked in 2008. Obama's Democrat landslide in 2008 turned the incarceration rate around. The cost of the U.S. drug war is at least 1.5 trillion dollars. Cannabis is safer! Share link. |
|

-

USA: Peak of 7.3 million people in 2007 under adult correctional supervision: On probation or parole, or incarcerated in jail or prison. About 3.2% of the U.S. adult population, or 1 in every 31 adults. More info here. See template.
-
Timeline of U.S. incarceration in prisons and jails as a percentage of Americans of all ages. Peaked in 2008. See template. Image source and data.
USA. Adult and juvenile inmate stats. Share link.
-
Source: Correctional Populations in the United States, 2013. See Appendix Table 2 in PDF. From U.S. Bureau of Justice Statistics. Incarceration rate is per 100,000. See template. See juvenile detention numbers.
-
Obama helping turn around Reagan-Bush War on Pot, mandatory minimums, mass incarceration:
Source: Correctional Populations in the United States, 2013. See Appendix Table 5 in PDF.
-

Obama helped turn around the Reagan-Bush War on Pot, mandatory minimums, mass incarceration. See: US incarceration peaked in 2008.
-
Incarceration rates for adult males in U.S. jails and prisons by race and ethnicity. At midyear 2009, an estimated 4.7% of black non-Hispanic men were in prison or jail, compared to 1.8% of Hispanic men of any race, and 0.7% of white non-Hispanic men. Sources. More info: Race, ethnicity, and the drug war. See template.
Cannabis is safer
Return to top. Full site / Mobile. To Top or End. Note: This section and the following ones are at: Beyond drug war, debt, and wealth concentration. To single-payer healthcare and progressive taxation.
See articles: Cannabis is safer. And:
History of US Republican-led war on cannabis, and their lies about its health effects.
See 2024 GMM-420 on Fandom and on Shoutwiki. See 2024 talk page (no need to log in) to leave event links, and especially compilations.
| To Top. Or End. Or Articles. |
Portugal's decrim
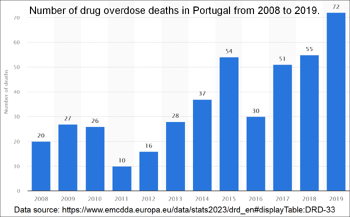
Return to top. See: Portugal. Cannabis-related links and decriminalization. See the utter failure of the US Republican-led drug war and mass incarceration: It is killing Americans at the rate of one Vietnam War every 6 months.
There were around 112,100 US drug overdose deaths in the 12-month period ending August 31, 2023, at a rate of 307 deaths per day. 335 deaths per million US population. Only around 10 to 72 total deaths per year in Portugal, a country with universal healthcare, and where all drugs have been decriminalized since 2001. See timeline table of yearly overdose deaths by European country.

  |
| Chart from: December 15, 2020 article: Scotland's drug death crisis in six charts. BBC News. |
Harm reduction
Return to top. End the expensive, incarceration-heavy US drug war with Portuguese and Canadian single-payer universal healthcare, and Portuguese decriminalization.
Government debt
Return to top. Share link: Debt ceiling. See: Wikipedia: US debt ceiling.
Save $1.5 trillion:
Per year in the US:
Single-payer
Return to top. Republicans oppose single-payer universal healthcare. US would save 1.5 trillion dollars per year if it instituted Canadian universal healthcare. That is 5.4% of US GDP.
Canada spent 11.2 percent of its GDP for total healthcare costs in 2022. US spent 16.6 percent in 2022. Former US Lawmaker Finally Enjoys Social Policies He Fought for—In Europe.
Medical bankruptcies
Return to top. See: Health Care Costs Number One Cause of Bankruptcy for American Families. And: Americans have high personal medical debt, unlike Canadians. [5][6][7]. High student debt is another problem Americans have due to Republican politicians. Unlike Canadians. Changing the age of adulthood to 17 would free up a year of education money.


US household debt at all time high. By quarters. 1st quarter 2003 to recent times. Chart.
US is Broke, not Woke. Healthcare spending and debt ceiling.
| To Top. Or End. Or Articles. |
Richer Canadians
Return to top. Many sleepy Americans can't do the math concerning healthcare costs and medical debt. Also, incarceration and family debt due to the GOP-led war on drugs. Also US student debt, and US household debt due to GOP's low minimum wages, etc...

Canadians are richer on average than Americans, and they have more energy because Canadians don't have to take 3 jobs, go bankrupt, or sell their homes, due to medical and student debt. See Wikipedia: List of countries by total health expenditure per capita. See: Student debt balance is forgiven after 15 years payment in Canada.
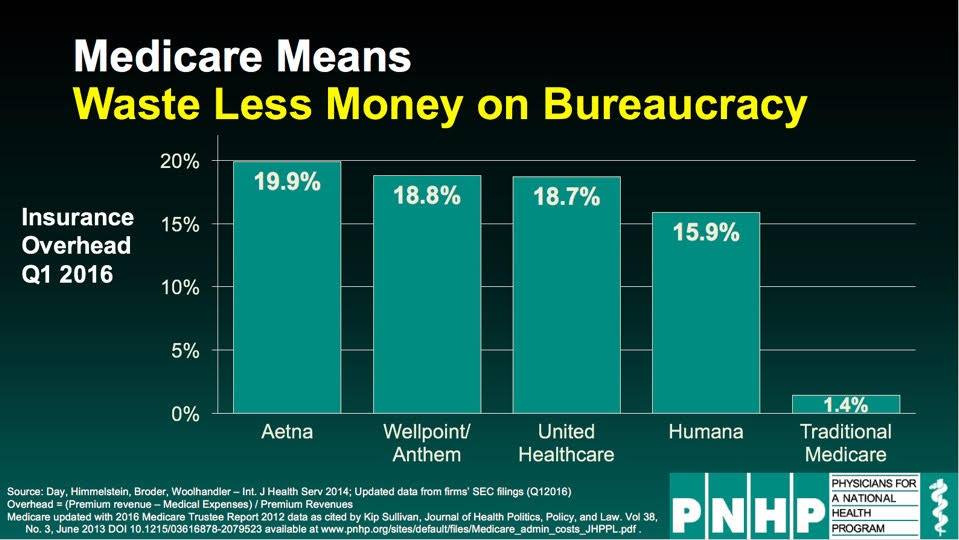
| USA. Two Leading Economists Say Medicare for All Would Give 'Biggest Take-Home Pay Raise in a Generation'. |
| Medicare spends 1.4% on bureaucracy. Insurance companies spend 16-20%. See chart. We need Medicare for All. |
Healthier Canadians
Return to top. See: End drug war with universal healthcare and decriminalization. Cannabis is legal across Canada. See Wikipedia: Cannabis in Canada.
|
US Republicans Voted Often to Kill Coverage of Pre-Existing Conditions. [8][9][10].
Health spending
Return to top. Republicans are responsible for the large US government deficit. Because they support the wasteful US healthcare system over the much cheaper single-payer universal healthcare in Canada and elsewhere. See: Canadian single-payer universal healthcare versus US healthcare.


See more countries.
| Wikipedia: Health spending by country. Percent of GDP. See Gross domestic product. 11.2% for Canada in 2022. 16.6% for the US in 2022. |
 |
| See Wikimedia chart source. |
| Wikipedia: Health spending per capita. OECD countries. US dollars, using economy-wide PPPs. Public, private, and total expenditures. $6,319 for Canada in 2022. $12,555 for the US in 2022. |
 |
| See Wikimedia chart source. |
Poor and sick:
Return to top. Canadians are healthier on average, and their preventive healthcare is much cheaper! Versus US Emergency Room care. See Wikipedia: Health spending as a percent of GDP by country (gross domestic product). And: Wikipedia: List of countries with universal health care.
| "The Easy-to-Digest Republican Party Platform" from Michael Moore has this image: "Keep 'em poor and sick". |
| To Top. Or End. Or Articles. |
Republican states;
Prohibition plus;
Return to top. See Wikipedia: Republican states.
See article: US Republican states. It's not just cannabis prohibition. Many maps. It's also their low minimum wages, high Covid death rates, poor healthcare, high household debt, high gun death rates, high homicide rates, high incarceration rates, etc.. See: Drug war and other excessive uses of force. They are autocratic gerrymandered states that have long avoided federal oversight due to the Republican filibuster. See Wikipedia: Filibuster in the United States Senate.
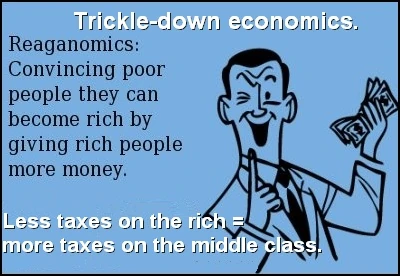
The US Republican Party wants to concentrate wealth at the top. So they want most people to be Broke, not Woke: Trickle-down economics. See: Beyond drug war and conservatism.
The federal minimum wage would be $13.46 in 2022 dollars if its real value had remained at the 1968 level. Even more in 2023 dollars. See graph below.
| Note the low minimum wages in the Republican south: |
 |
| History of the US federal minimum wage. $13.46 inflation-adjusted peak in 1968. $7.25 an hour now due to Republican filibusters in the US Senate. See Wikimedia GIF chart. |
 |
- See Wikipedia: Republican states.
- Wikipedia: List of US states by minimum wage.
- Wikipedia: List of European countries by minimum wage.
Voter suppression;
Return to top. Vote out the many Republicans supporting backward cannabis laws. It is purposely made more difficult by the lack of no-excuse postal voting. Just one example of Republican voter suppression in GOP states. Such as many states in the south.
See Wikipedia: Postal voting in the United States.

Lies of GOP radio
Return to top. Google image search: Top right wing radio hosts.
How Fox News and the Right-Wing Media Machine Made My Dad Crazy. Republicans dominate talk radio. Especially in the Republican south with its backward cannabis laws.
See Wikipedia: Conservative talk radio. A percentage of people in many states do not have access to broadband internet, and desktop or laptop computers. Cell phones are a poor substitute for many people. So they are left with Republican misinformation radio.
| To Top. Or End. Or Articles. |
Senate filibuster
Return to top. A minority of Senators should not be able to block cannabis laws supported by the majority of Americans.
The War on Cannabis. It accelerated in the US, and that's where it will end. US Congress could legalize, reschedule, or remove cannabis from the federal schedule if the Republican filibuster were gone. Vote in US Senators who will abolish it. [12][13][14][15]. Senators Manchin or Sinema could abolish it now.

Electoral college
Return to top. Presidents should not be elected who do not receive the highest number of votes.
Abolish the electoral college. Imagine the US without the 12 years of the Bush and Trump presidencies and their backward cannabis policies.

Ranked voting
Presidential veto
Return to top. Presidents should not be able to block cannabis laws supported by the majority of Americans.
See Wikipedia: Veto power in the United States.
| To Top. Or End. Or Articles. |
End war powers
Return to top. Nixon, Reagan, and Bush are responsible for the US War on Drugs, and the lie that massive incarceration is a solution. See more lies in
Reagan's frequent demonization of cannabis.
Presidents have too much power. Wars later determined to be started based on lies of Presidents, or done in secret:
Vietnam War: President Johnson and the lie of the Gulf of Tonkin incident.
Cambodia: Nixon and Kissinger's secret B-52 carpet bombing campaign that helped create the unrest that led to Pol Pot's genocidal regime. And Kent State shootings in US.
Iraq War: President Bush and the lie of the weapons of mass destruction in Iraq.
Trump and Biden
Return to top. Institute a mandatory retirement age for US Congress members and the President. [16]. Mandatory retirement exists for many US judges. Both Donald Trump and Joe Biden are too old to be President. And Trump is just too dumb: Video: Robert De Niro on Trump Being “So F**king Stupid”. See Robert Reich: Seriously, again, how dumb is Trump? And: Trump’s Brain Is Not Okay. An expert’s view of Trump’s mental slide into dementia.
Generic Democrats
Return to top. Biden and Trump both underperform generic opponents, poll finds. A Plea to Biden: If You Truly Want to Prevent Trump Authoritarianism, Please Withdraw. Trump was not good for cannabis reform the last time around. We need more cannabis reform. That does not come from the Republican Party. Generic ballot : 2024 Polls | FiveThirtyEight. Biden needs to drop out. March 09, 2024 Newsweek report on poll: Joe Biden Voters Tell Him to Drop Out.


Source. Text added later. More "flying hair" photos.
Gaza. Canada vs US
Return to top. Compare genocidal American politicians to Canada's politicians stopping military aid to genocidal Israel. Read EXCERPT: Bernie Sanders: "This bill also provides another $3.3 billion in U.S. military aid for Netanyahu’s right-wing government to continue this barbaric war. The Netanyahu government should not receive another penny from U.S. taxpayers."
Gallup Poll chart below showing US change from majority approval (Nov. 2023) to majority disapproval (March 2024) of Israeli military action in Gaza. Source: Majority in U.S. Now Disapprove of Israeli Action in Gaza. March 27, 2024 by Jeffrey M Jones. Gallup Poll.

Tax cuts for rich
April 15, 2024. Biden: "If Congress enacted President Biden’s tax plan, tens of millions of workers and families would have their taxes cut, nobody making less than $400,000 would pay a penny more in taxes, and the wealthy and big corporations would finally pay their fair share—which would fully pay for the President’s tax cuts and investment agenda."
Democrats who attack the rich do better in elections. The party should take notice. Republican dynasties created by regressive taxation: See: The poster child for the perils of dynastic wealth. By Robert Reich.
| Trump's 2017 tax cuts for the rich. |
 |
| On average, taxpayers in the income groups highlighted in yellow will incur a net cost (shown as a positive figure as this reduces the budget deficit), due in part to reduced healthcare subsidies. Higher income taxpayers receive a benefit via tax cuts (shown as a negative number as this increases the budget deficit). The percent of taxpayers in each income group is also shown for the 2023 period. "Taxpayer" in the chart refers to a tax return, meaning it could represent one person or a married couple filing jointly, among other options. [17][18]. Commons source. |
Wealth inequality
Return to top. See: Wikipedia: Progressive tax. Mar 19, 2024: Sanders, UAW president press harder for shorter workweek. "Today, American workers are more than 400 percent more productive than they were in the 1940s. And yet, despite this fact, millions of our people are working longer hours for lower wages," they wrote. "In fact, 28.5 million Americans now work over 60 hours a week and more than half of full-time employees work more than 40 hours a week." After adjusting for inflation, American workers make almost $50 less a week than they did 50 years ago, they said.
Jan 24, 2024 article: $8.5 Trillion in Untaxed Assets: Data Shows Why 'We Need a Billionaire Income Tax'. EXCERPTS: analysis found that the wealth of America's billionaires and centimillionaires has exploded in recent years as Republicans have enacted massive tax cuts for the rich ... "The cumulative $8.5 trillion of unrealized capital gains held by America's billionaires and centi-millionaires in 2022 has jumped by more than half–or $3.2 trillion–just since the last Fed survey year of 2019," END.
USA. The sorry state of the nation.

| US federal income tax rate on billionaires averages only 8.2%. Click image to enlarge. |
 |
| "Most taxpayers, including firefighters and teachers, average a federal income tax rate of approximately 13.3%." |
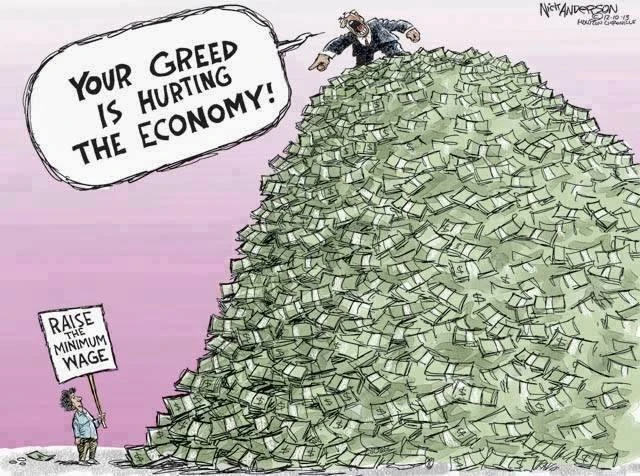
Minimum wage
Return to top. Beyond drug war, debt, and wealth concentration. To single-payer healthcare and progressive taxation. Simultaneous with the Republican-led drug war the GOP used the Senate filibuster to undemocratically severely restrict increases in the minimum wage at the federal level, and in GOP states.

| US minimum wage would be $23 an hour in 2021 if it had kept up with productivity. |
 |
- A $15 minimum wage would cost jobs, right? Probably not, economists say.
- There’s More Evidence That Raising the Minimum Wage Won’t Cost Jobs.
- The U.S. has one of the stingiest minimum wage policies of any wealthy nation. Washington Post.
| To Top. Or End. Or Articles. |
Global warming
Return to top. World Population Clock: 8 Billion People (LIVE). We need more trees and less people. More oxygen, less carbon dioxide. To slow down global warming. "Assuming no net migration and unchanged mortality, a total fertility rate of 2.1 children per woman ensures a broadly stable population." - Fertility rates. OECD Data. See country graphs. Also, inflation comes from an increasing population sharing one planet's resources.
Many US Republican leaders oppose birth control and abortion rights (even early abortion). Another reason besides their backward cannabis laws to vote them out. Birth control and abortion (especially early abortion) is legal (even free) in many countries. That needs to expand further.
We need the lowest curve below, by lowering the birth rate.
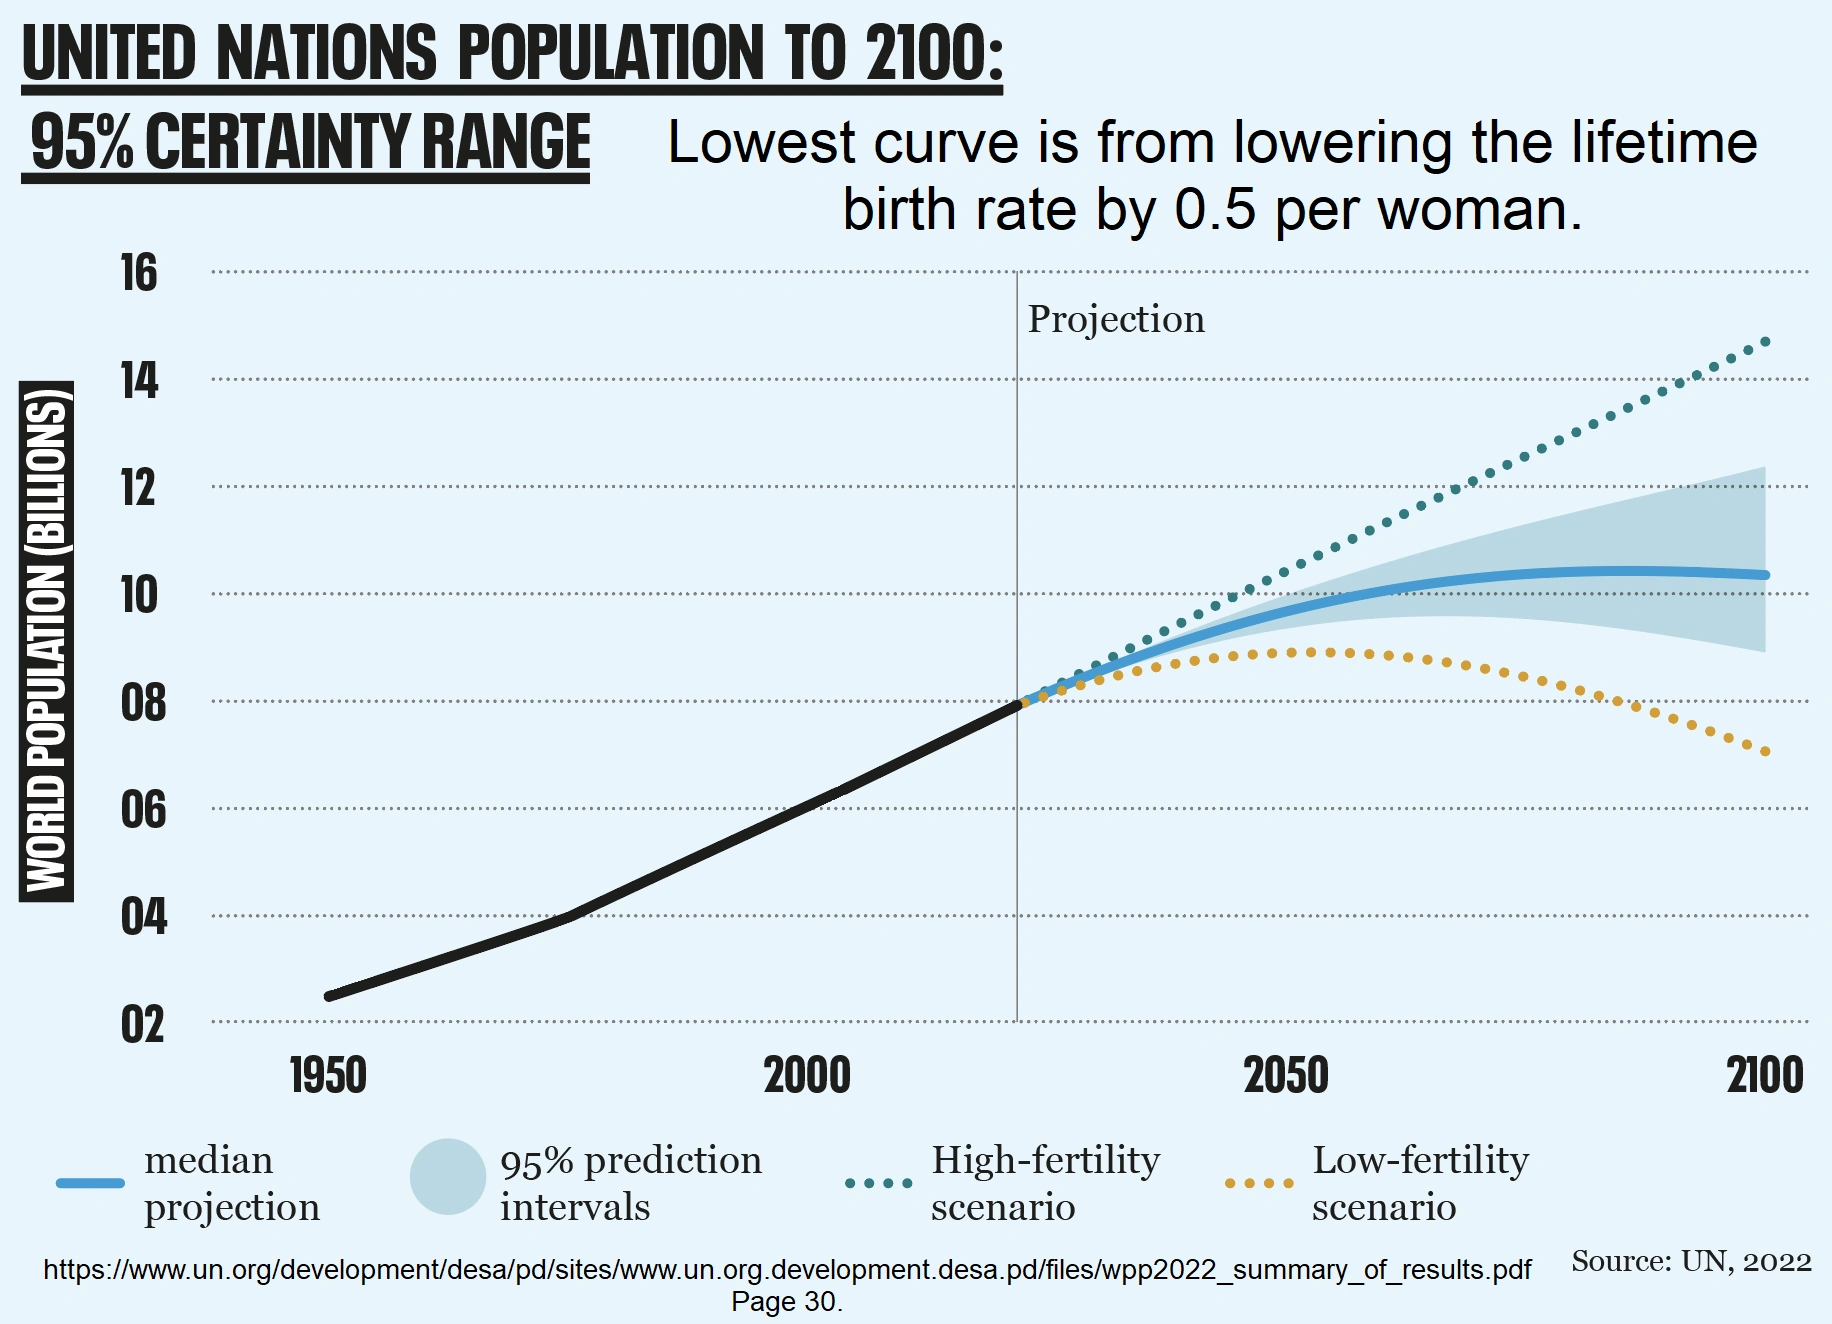

See page 30 of source.
Immigration
Return to top. The US and Europe can't import all the overpopulation of the world. Europe, especially, is already too densely populated. US Democrats and progressives in Europe need to limit immigration, or they will lose power, and cannabis policies will stagnate under right wing rule. Taxes on the rich will be cut yet more, which by definition means middle class taxes will go up, or stay up, to pay for it. Wikipedia: List of countries and dependencies by population density.

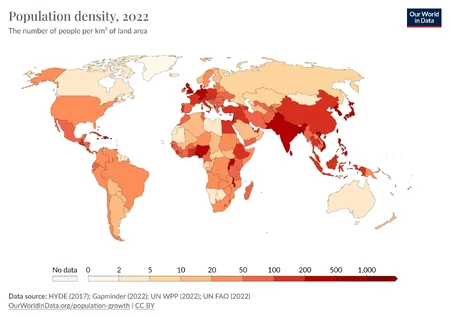
See source.
| To Top. Or End. Or Articles. |
Roswell. Warming

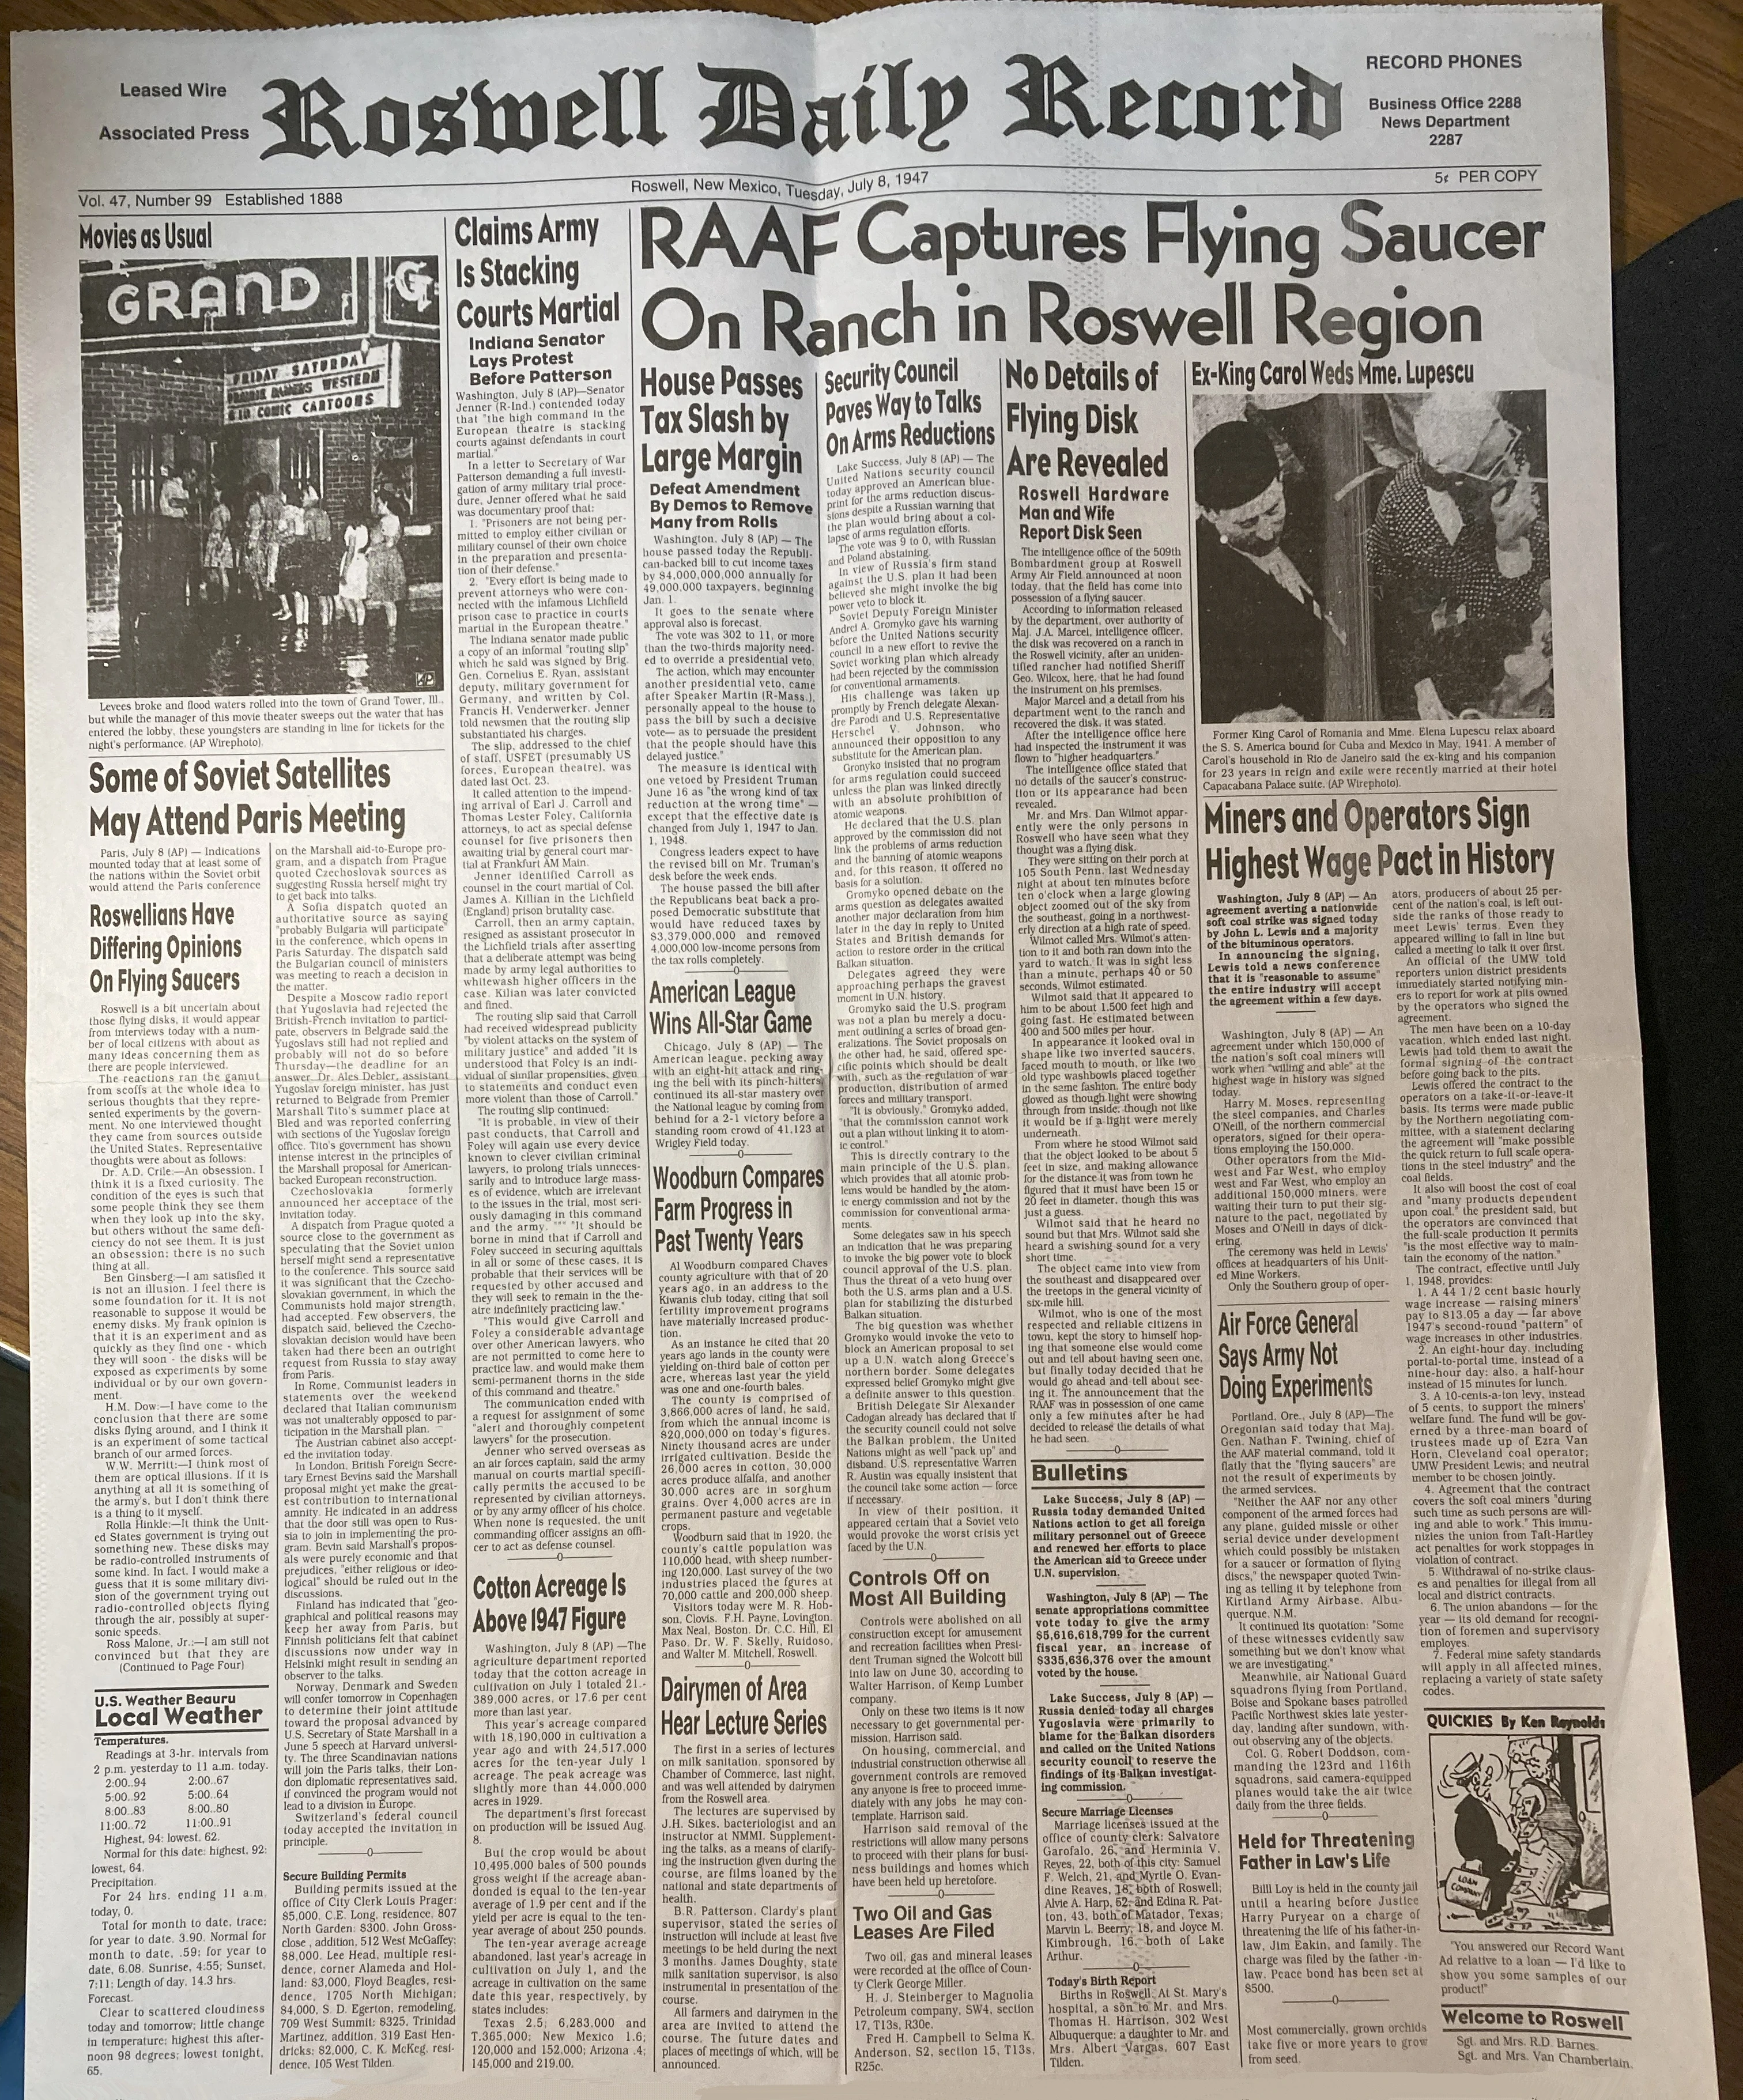
Share link: Roswell UFO. Much UFO technology has been back engineered, and its carbon-free energy could end global warming. See Stephen Greer playlist. [20][21][22][23][24] [25][26][27][28] [29][30]. Wildest: [31][32]. See also the David Grusch disclosures at July 26, 2023 House hearing about US possession of aliens, alien bodies, alien craft, and back engineering: [33][34][35][36] [37][38][39][40][41] [42][43][44][45]. See History channel: [46][47][48][49]. National Geographic: [50][51].
See the July 8, 1947 Roswell Daily Record below. Image info. Click image to enlarge. Full-size is readable. See full text of saucer article. [52]. U.S. Army officer Walter Haut issued the initial "flying disc" press release. His 2002 notarized affidavit said there were 2 crash sites, and that he had seen a craft, alien bodies, and handled wreckage material. (see page 14 of pdf). It was released in a 2007 book after his death in 2005.


Walter Haut in 1947

Affidavit is on pages 239-242 of the 2022 edition: Witness to Roswell, 75th Anniversary Edition: Unmasking the Government's Biggest Cover-up (more eyewitnesses). 36 pages previewed in Google Books. Click "preview" button and scroll down to pages 239-240. Search within the book. There is an inexpensive Kindle ebook. Moonwalker Dr. Edgar Mitchell wrote the foreword. The 20 paragraph affidavit is online here: [53] (page 14). [54][55].
Haut's daughter, Julie Shuster, in 2002, 3 years before his death, "verbally discussed each and every sentence" of the affidavit with him. She said it was not a deathbed confession. See Sept 2007 MUFON UFO Journal. Issue 473. Page 15. And this article from Special Broadcasting Service. Archived. See Julie Shuster on IMDb.
Google search: Walter Haut 2002 Roswell affidavit. Articles about Haut:
30 June 2007: Roswell officer's amazing deathbed admission raises possibility that aliens DID visit. By Nick Pope. Same article also published here and here. Archived here and here.
5 June 2022: Roswell officer's deathbed confession about theory of alien cover up. By Declan Carey. Archived here.
14 May 2021: Ex-Army officer ADMITS he saw ‘alien the size of a 10-year-old child’ after famous Roswell UFO crash in incredible video. By Emma Parry. Archived here. This article has a short excerpt of the video.
May 2021: Roswell Officer Speaks From the Grave: Video Released, Confesses that Alien was "the size of a 10 year old". By Anthony Bragalia. Archived here. From article (emphasis added): "This video clip is part of a memoir video / oral history over two hours in length that covers many personal and professional aspects of Haut's life. The video was taken at the Roswell Museum in 2000 with friends Dennis Balthaser and Wendy Connors."
Galactic Pot March


![]() Return to top. See 2024 GMM-420 on Fandom and on Shoutwiki. Note: See the sections at the bottom of many pages: Beyond drug war, debt, and wealth concentration. To single-payer healthcare and progressive taxation.
Return to top. See 2024 GMM-420 on Fandom and on Shoutwiki. Note: See the sections at the bottom of many pages: Beyond drug war, debt, and wealth concentration. To single-payer healthcare and progressive taxation.
2024 talk page (no need to log in) for event links, and especially compilations.
| To Top. Or Articles. Categories. |
Full site / Mobile. Weed War. 2023. 2024. Years. Home. Republican states. Canada. Portugal. End.
Categories